Example
Ex :
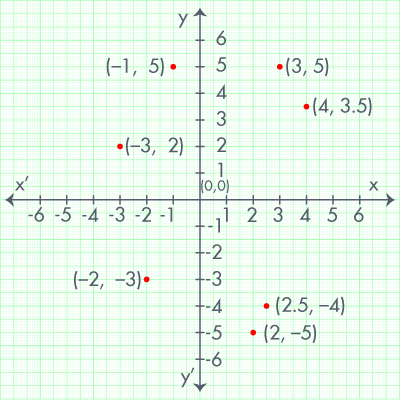
Plot the points (x, y) given in the following table on the plane, choosing suitable units of distance on the axes.
| x | –2 | 2 | –1 | 4 | 2.5 | 3 | –3 |
|---|---|---|---|---|---|---|---|
| y | –3 | –5 | 5 | 3.5 | –4 | 5 | 2 |
Sol:
The locations of the points are as shown in below graph.