The time of arrival and departure of a train at three stations A, B and C and the distance of stations B and C from station A are given in the below table.
| Station | Distance from A (km) | Time of arrival (hours) | Time of departure (hours) |
|---|---|---|---|
| A | 0 | 08:00 | 08:15 |
| B | 120 | 11:15 | 11:30 |
| C | 180 | 13:00 | 13:15 |
Plot and interpret the distance–time graph for the train, assuming that its motion between any two stations is uniform.
We should take two axes on the graph paper. The X–axis represents time, while the Y–axis represents distance.
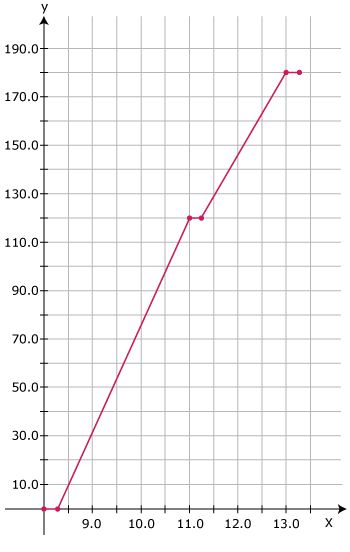
- At 8:15 distance = 0 km
- At 11:15 distance = 120 km
- At 13:15 distance = 180 km
Raj and his sister Sania go to school on their bicycles. Both of them start at the same time from their home but take different times to reach the school although they follow the same route.
The table below shows the distance travelled by them at different times.
| Time | Distance travelled by Raj (km) | Distance travelled by Sania (km) |
|---|---|---|
| 8:00 am | 0 | 0 |
| 8:05 am | 1 | 0.8 |
| 8:10 am | 1.9 | 1.6 |
| 8:15 am | 2.8 | 2.3 |
| 8:20 am | 3.6 | 3 |
| 8:25 am | – | 3.6 |
Plot the distance–time graph for their motions on the same scale and interpret.
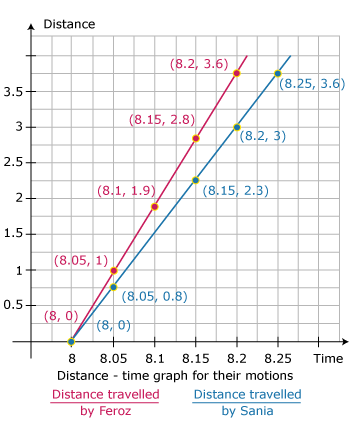
- Distance-time graph for their motions
The slope of the graph gives the speed. From the graph, it is evident that the speed of Feroz is better than Sania. Therefore, Feroz reaches Sania and waits for her.
From the given distance–time graph below, find (a) the distance travelled by the object from 8.30 a.m. to 9.15 a.m. and (b) the speed of the object from A to B.
(a) The distance travelled from 8.30 a.m. to 9.15 a.m. can be determined by PQ = 50 – 20 = 30 km.
The speed can be calculated from the graph.
For example, the time taken to travel the distance AB (70 – 30 = 40km) is given by CD (9.45 – 8.45 = 1 hour).
Therefore, speed = AB/CD = (40 km)/(1 hr) = 40 km/h.