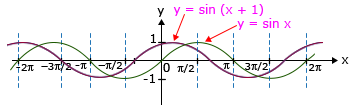
1. To draw the graph of y = f(x + a); (a > 0) from the graph of y = f(x), shift the graph of y = f(x), a units left along the x-axis.
Consider the following illustration.
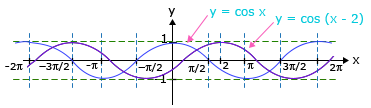
To draw the graph of y = f(x – a); (a > 0) from the graph of y = f(x), shift the graph of y = f(x), a units right along the x-axis.
Consider the following illustration.
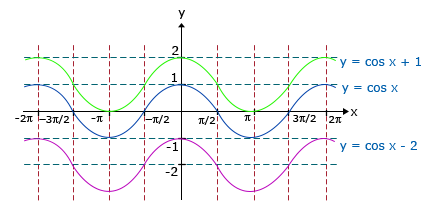
2. To draw the graph of y = f(x) + a; (a > 0) from the graph of y = f(x), shift the graph of y = f(x), a units upward along the y-axis.
To draw the graph of y = f(x) – a; (a > 0) from the graph of y = f(x), shift the graph of y = f(x), a units downward along the y-axis.
3. If y = f(x) has period T, then period of y = f(ax) is T/|a|.
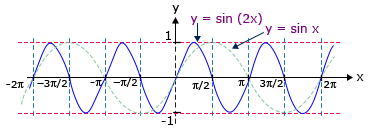
Period of y = sin (2x) is 2 .  = π.
= π.
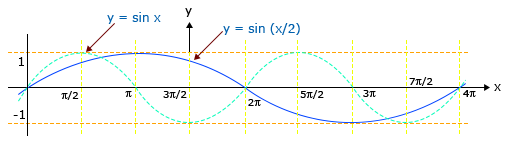
Period of y = sin (x/2) is 2π/(1/2) = 4π.
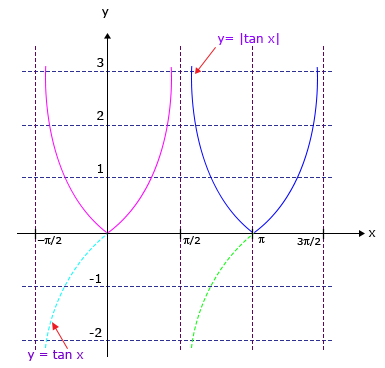
4. Since y = |f(x)| ≥ 0, to draw the graph of y = |f(x)|, take the mirror of the graph of y = f(x) in x-axis for f(x) < 0, retaining the graph for f(x)> 0.
Consider the following illustrations.
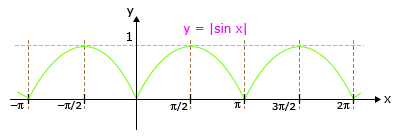
Here period of f(x) = |sin x| is π.
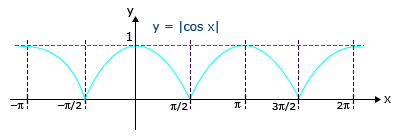
Here period of f(x) = |cos x| is π.
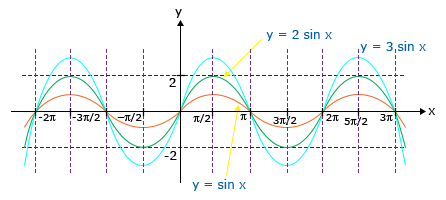
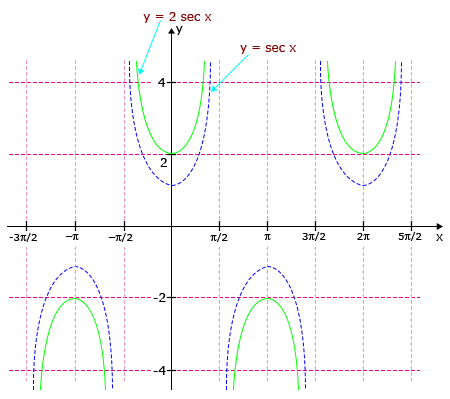
5. Graph of y = a f(x) from the graph of y f(x).