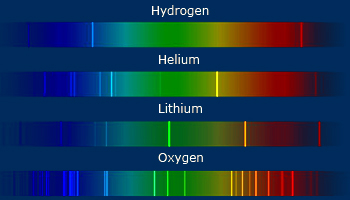
 During early days of 20th century, elements are characterized by their spectrum. No two elements will give
same spectra. Every atom will have its own spectra characteristic of it. Above shown are the spectra of hydrogen, helium, lithium
and oxygen atoms.
During early days of 20th century, elements are characterized by their spectrum. No two elements will give
same spectra. Every atom will have its own spectra characteristic of it. Above shown are the spectra of hydrogen, helium, lithium
and oxygen atoms.
It was known around the early part of the 20th century that atoms emit different light spectrum of each element. The pattern of frequencies formed by a given element is referred to as that element's atomic spectrum. The atomic spectrum is an element's fingerprint. We can identify the elements in a light source by analyzing the light through a spectroscope and looking for characteristic patterns.
 Transitions between various levels showing different lines in Hydrogen spectrum
Atomic spectra :
When atoms are heated or subjected to an electric discharge, they absorb
energy, which is subsequently emitted as radiation. For example, if sodium chloride is heated in the flame of Bunsen burner,
sodium atoms are produced which gives out a characteristic yellow flame coloration (there are two lines in emission spectrum of
sodium corresponding to wavelengths of 589 nm and 589.6 nm). Spectroscopy deals with the study of either radiation absorbed or
radiation emitted. Atomic spectroscopy is an important technique for studying the energy and the arrangement of particles in the
atoms.
If a discharge is passed through hydrogen gas (H2) at low pressure, some hydrogen atoms (H) are
formed, which emits light in the visible region. This light can be studied with a spectrometer. Four lines can be seen by naked
eye, but there will be many more observed photographically in the ultraviolet region. The lines become increasingly close together
as wavelength (λ) decreases. Wavelengths are related to the frequency by the relation

Where ‘c’ is the velocity of light (3 × 10⁸ ms−1). In
spectroscopy frequencies are generally expressed as wave numbers

where

 Transition of electron from higher energy level to the first level will result in Lyman series in which
the lines correspond to the ultra violet region of electromagnetic spectrum, to the second level result in visible region
(Balmer series), infrared region to the third and successive levels there on.
Transition of electron from higher energy level to the first level will result in Lyman series in which
the lines correspond to the ultra violet region of electromagnetic spectrum, to the second level result in visible region
(Balmer series), infrared region to the third and successive levels there on.
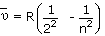
In the year 1885, Balmer showed that the wave number
of any line in the spectrum of atomic hydrogen could be given by the simple empirical formula:
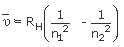
Where RH = Rydberg constant, which is equal to (109,678 cm−1) and n1 and n2 are variables whose values are whole numbers that range from 1 to 8. The only restriction is that the value of n2 must be larger than n1 (to make the calculated wavelength to be a positive value).
The spectrum of ‘H’ atom is divided into various series. The lines observed in the visible region are called the Balmer series. Similarly the lines in the ultraviolet region are called Lyman series, Paschen series, Brackett series, Pfund series and Humphreys series are observed in infrared region of electromagnetic radiation.
The equation for lines in Lyman series is given by,
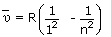 Where n = 2, 3, 4, 5...
and equation for lines in Balmer series is,
 Where n = 3, 4, 5...
Similarly n1 = 3 for Paschen series, 4 for Brackett, 5 for Pfund and 6 for Humphreys series are to be taken into consideration. Here only n2 value varies for the lines in their series.